Main menu

You are here
Tracking and recovering weather balloons, by Ralph Adams, VA7VZA
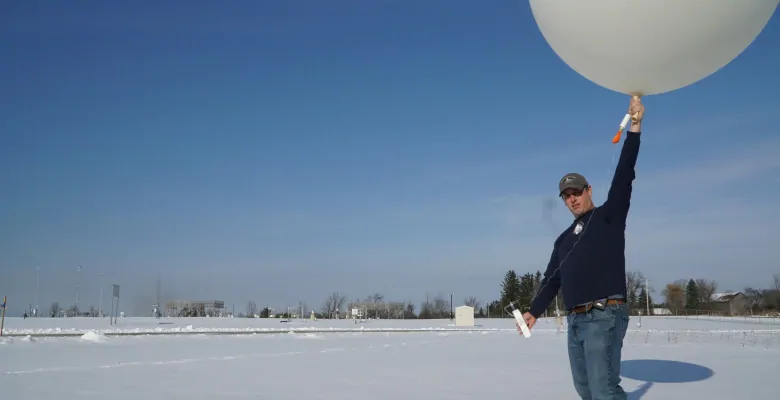
At over 800 locations around the world, at 0:00 and 12:00 UTC every day, a strange ritual is performed. Technicians fill a latex or neoprene balloon with a metered volume of hydrogen or helium, and then attach a small instrument package (called a radiosonde) to the now bouyant balloon. The balloon is then released and rises through the atmosphere dragging along the radiosonde. As it rises, temperature, pressure, and humidty measurements, as well as GPS derived location and elevation, are telemetered back to the launch station. The location and elevation are used to calculate the windspeed and direction with height. The balloon keeps on rising and being carried downwind until the balloon can expand no more and bursts. By this time the balloon can be as high as 30 km above the surface and up to several hundred kilometres downwind of the launch site. Within a few hours the data have been checked and shared between meteorological agencies and databases around the world.
Why?
The measurements, called upper air soundings, are extremely important in determining the stability of the atmosphere and are used as inputs to computer models that are used to forecast the weather. The are also used by forecasters to predict if lightning and damaging thunderstorms are likely, how the atmosphere is able to disperse pollutants like smoke and other pollutants, and to control when open burning of logging slash can occur. The data are also used in other models like climate change simulations and pollutant dispersion models. Remember the dispersion modelling done during the application for the Ajax mine near Kamloops, the model used upper air observations for the three year period to project dust emissions and other pollutants and how they could affect Kamloops residents.
Where?
In British Columbia there are four stations where radiosondes are launched twice a day: Prince George, Vernon, Port Hardy, and Fort Nelson. As well there are stations in Washington State at Spokane and Quillayute, and in Alaska at Annette Island, from which radiosondes can fly over BC after launch.
The station in Vernon has had a strange history -- the station was on the ridge west of Kalamalka Lake and Highway 97 until the 1980s. In those days there were no GPS satellites and the location and elevation of the rising radiosonde was determined with radar. This required a large installation for each ground station. When the Mountain Weather Office was established on the grounds of what is now UBC Okangan in Kelowna, the launch site was moved there. A few years ago, UBCO decided that expanding a parking lot was more important than upper air soundings and the station was evicted. There were no upper air data available for the Southern Interior of BC for several years until a new station in Vernon was established by Environment Canada. Next time you drive to Kelowna, look to the west (right) as you pass the Kalamalka Forestry Research station and you will see the old upper air station on the ridge. It is now used as a community eductation centre. Environment Canada is hoping to use the old station again, but until then the radiosondes are launched from the Water Survey of Canada office at the north end of Vernon.
The current and historical data for all stations are freely available from various internet databases. One of the easiest to use if the University of Wyoming site at: http://weather.uwyo.edu/upperair/sounding.html
Here is an example of the data collected. This is the data collected at 12:00 UCT on October 1st 2020.
This is the sounding data plotted onto what is called a thermodynamic plot; people have been known to go mad trying to figure them out. And it does not help that there are many different kinds that show the same data in completely diferent ways. This one is called a Skew T - Log P (T is temperature and P is pressure) and is commonly used in the USA and at universities in Canada. Environment Canada uses another type called a tephigramme. At any meeting with meteorologists from the various agencies and universities involved there will be good natured (usually but not always) arguing about which is better. So... just hitting the interesting bits: the highest point plotted is at 100 HPa (the pressure at the surface is about 1000) at an elevation over 15,000m, and the temperature is around -50 or -60C. The balloon would still be rising at that point and they can go as high as 30,000m before bursting. On the right hand side there are a series of "barbs", these are used to indicate speed in knots and the direction. The direction the barb is pointing shows where the wind is coming from. Each half-barb is 5 knots, full barb is 10 knots and a triangle is 50 knots. So the maximum speed of 60 knots (108 km/h) occurred between 13,000m and 14,000m and the wind was coming from WNW.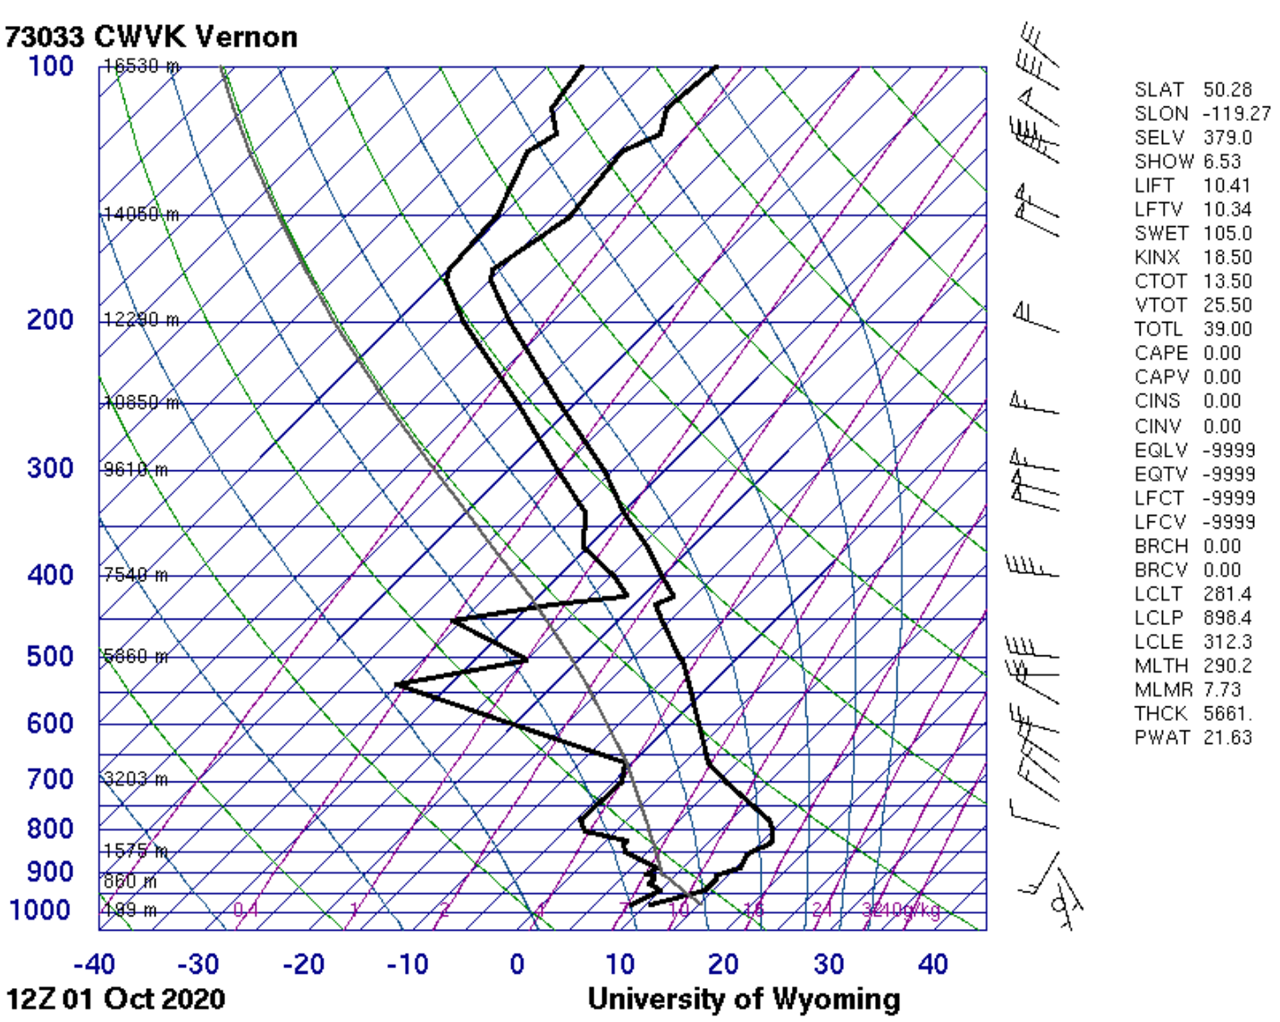
If you look at the solid line on the right, which shows temperature, you will see it moves to the right up until about 2,000m and then moves to the left generally following one of the blue lines. This tells you that there was an inversion below 2,000m. An inversion occurs when the normal decrease of temperature with height is reversed and temperature increases with height resulting is very poor mixing of the atmosphere in that layer. There was a lot of haze in the Southern Interior caused by this inversion through most of the day on October 1st. Notice that there is another inversion (the line starts to go to the right again) up around 13,000m. This is always there. It indicates the beginning of the stratosphere. When thunder clouds form an anvil shape at their top, that indicates that the rising air has hit the inversion at the bottom of the stratosphere and cannot rise further into the stable air above the inversion.
Why do we care?

On the internet there are numerous sites which describe how different groups are tracking and recoving radiosondes. Here are two that I liked: From Techminds in the UK; and, from a Canadian in Ontario who has recovered US radiosondes falling in Canada.
In simple terms, the process is: be in reception range for a launch from a specific site, a receiver is needed (SDRs seem to be the radio of choice due to their low cost and ability to set wide bandwidths; the transmitters seem to be 100mW or less, similar to the AMSATs) with a high-gain antenna tuned to the correct frequency (1600MHz for the US ones, 403 MHz for other countries), once the launch occurs the signal from the radiosonde is decoded using the appropriate software . The data includes the GPS location and elevation which can be used to track the location of the radiosonde. In some cases the location data can be used to guide the antenna in a way similar to that used with LEO AMSATs. With luck, enough data will be recovered to track and estimate the landing location of the radiosonde. The second video above shows the radiosonde being retrieved from a tree.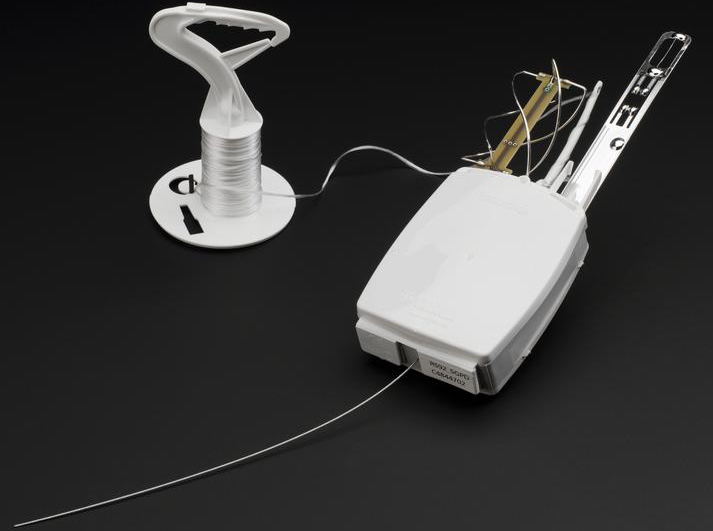
Your Mission, should you accept!
This sounds like too much fun to pass up and, if it works, would be a great way to introduce radio to kids. I am going to give it a try, this is an outline of what needs to be done.
- Find out exactly where the Vernon launch site is and what brand of radiosonde is being used. This is needed to select the correct decode software and receive frequency. I have made contact with one of my former colleagues in Environment Canada and I'm sure they can point me to the answers. In Canada the Vaisala radiosondes from Finland are currently being used, but the CBC story mentioned above suggests that they are switching to the new DFM radiosondes from Germany. You could go to the site to confirm the time that the lauches take place (the specification is within an hour of 0:00 and 12:00 UCT).
- Try tracking some launches to figure out where the best location to set up the reciever would be. The balloons rise rapidly out of the valley, so a high vantage point may make it easy to track for long distances. The trajectory depends on the winds high in the atmosphere, which are generally from the SW, but it is not uncommon for the balloons to head for Kamloops. It may also be possible to track them from a high vantage point near Kamloops.
- Once tracking and mapping the track is accomplished, the next step is to try to locate some of the radiosondes that we have tracked. One thing I'm not sure of is if the radiosondes are still transmitting when they crash-land.
If anyone is intested in giving this a try, please let me know. I can be reached at rsadams@telus.net